These Blackstone statistics highlight the firm’s latest assets under management, fee-earning capital, perpetual capital, dry powder, annual revenue, earnings, dividends, business mix, private wealth scale, and public market valuation.
Blackstone statistics
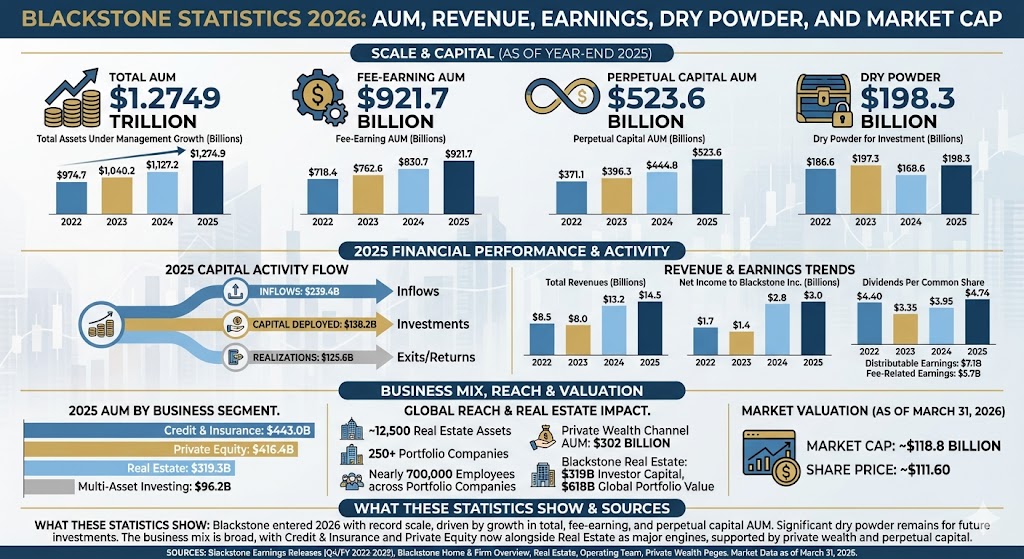
Blackstone statistics 2026: top highlights
Blackstone finished 2025 with $1.2749 trillion in total AUM.
Fee-earning AUM reached $921.7 billion at year-end 2025.
Perpetual capital AUM rose to $523.6 billion in 2025.
Dry powder available for future investments stood at $198.3 billion at year-end 2025.
Blackstone reported $239.4 billion of inflows, $138.2 billion of capital deployed, and $125.6 billion of realizations in 2025.
Total revenues rose to $14.5 billion in 2025, up from $13.2 billion in 2024.
Net income attributable to Blackstone Inc. reached $3.0 billion in 2025.
Distributable earnings were $7.1 billion in 2025, while fee-related earnings were $5.7 billion.
Dividends per common share totaled $4.74 in 2025, up from $3.95 in 2024.
Blackstone’s 2025 AUM by business segment was led by Credit & Insurance at $443.0 billion, followed by Private Equity at $416.4 billion and Real Estate at $319.3 billion.
Blackstone says it has ~12,500 real estate assets, 250+ portfolio companies, and nearly 700,000 employees across its portfolio companies.
Blackstone’s private wealth channel managed $302 billion as of December 31, 2025.
Blackstone Real Estate reported $319 billion of investor capital under management and a global real estate portfolio valued at $618 billion.
As of March 31, 2026, Blackstone shares traded around $111.60, implying a market cap of about $118.8 billion.
Max = $443.0B. Widths: Credit & Insurance 100.00%, Private Equity 94.00%, Real Estate 72.08%, Multi-Asset Investing 21.72%
What these Blackstone statistics show
Blackstone entered 2026 with record scale. Total AUM, fee-earning AUM, and perpetual capital all moved higher in 2025, while dry powder remained close to $200 billion, giving the firm significant capacity for future dealmaking.
The business mix also shows why Blackstone has become so broad. Credit & Insurance and Private Equity now sit alongside Real Estate as major engines of AUM, while private wealth, perpetual capital, and fee-related earnings continue to support a larger recurring revenue base.
Sources
Blackstone fourth quarter and full year 2022 earnings press release
Blackstone fourth quarter and full year 2023 earnings press release
Blackstone fourth quarter and full year 2024 earnings press release
Blackstone fourth quarter and full year 2025 earnings press release
Blackstone home page and firm overview pages
Blackstone Real Estate page
Blackstone Operating Team page
Blackstone Financial Advisors and Private Wealth pages
Discover the 10 best natural gas power burners for 2026, crafted for efficiency and performance—find out which one will transform your outdoor cooking!
Compare the best fire pit grills with Santa Maria attachment options for adjustable open-flame cooking, kettle-grill fits, and backyard barbecue control.
Navigate through our top 10 kamado tables with side shelves and discover the perfect setup for your grilling adventures—your ultimate outdoor cooking awaits!
Make your smoking experience unforgettable with the best vertical pellet smokers under $1000 for 2026; discover which models will elevate your culinary game.