These Weber statistics show how the company scaled into one of the best-known names in outdoor cooking, how sales surged during the backyard-cooking boom, and how its retail, direct-to-consumer, and e-commerce channels shaped the business before Weber went private and later combined with Blackstone.
Weber statistics
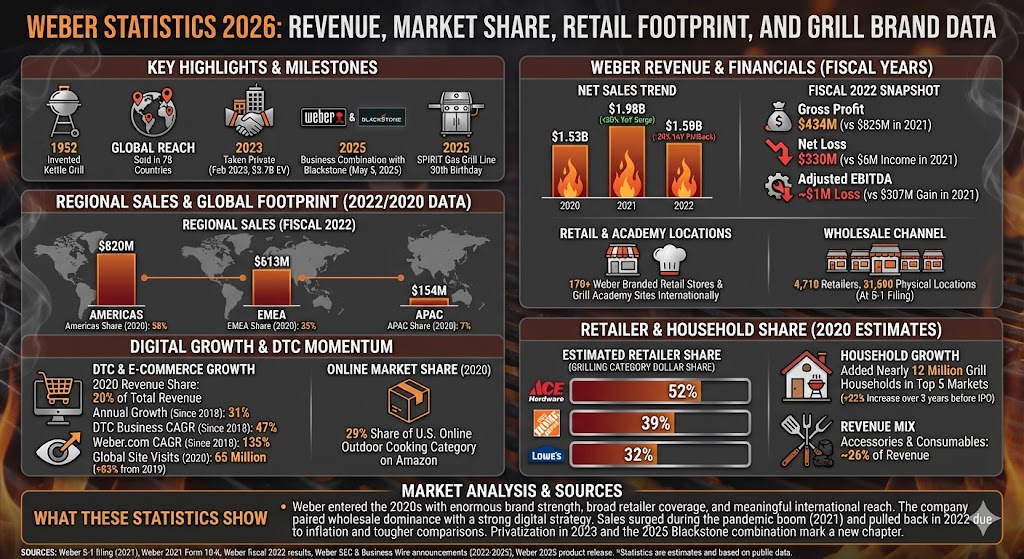
Weber statistics (top highlights)
Weber says it created the kettle grill in 1952.
Weber’s public-company materials said its products were sold in 78 countries.
Weber generated $1.525 billion in net sales in fiscal 2020.
Weber net sales rose to $1.982 billion in fiscal 2021, up 30% year over year.
Weber net sales fell to $1.586 billion in fiscal 2022, down 20% from 2021.
Fiscal 2022 gross profit was $434 million, versus $825 million in fiscal 2021.
Weber reported a $330 million net loss in fiscal 2022 after a $6 million net income in fiscal 2021.
Adjusted EBITDA moved from a $307 million gain in fiscal 2021 to a roughly $1 million loss in fiscal 2022.
In fiscal 2022, Weber generated $820 million in Americas sales, $613 million in EMEA sales, and $154 million in APAC sales.
In 2020, approximately 58% of revenue came from the Americas, 35% from EMEA, and 7% from APAC.
Weber’s wholesale channel included 4,710 retailers with 31,690 physical locations at the time of its S-1 filing.
Weber also reported 170 Weber branded retail stores and Grill Academy sites internationally.
DTC and e-commerce channels together represented 20% of Weber’s 2020 revenue.
Weber said those DTC and e-commerce channels had grown 31% annually since 2018.
Weber said its DTC business had grown at a 47% CAGR since 2018, while Weber.com had grown at a 135% CAGR over the same stretch.
Weber.com recorded 65 million global site visits in 2020, up 83% from 2019.
According to Weber management estimates, the brand held 29% share of the U.S. online outdoor cooking category sold on Amazon in 2020.
Weber also estimated it represented 52% of Ace Hardware’s grilling category dollar share, 39% at Home Depot, and 32% at Lowe’s in 2020.
Over the three years before its IPO filing, Weber said it added nearly 12 million grill households in its top five markets, a 22% increase.
About 26% of Weber revenue came from accessories and consumables.
Weber’s December 2022 take-private deal implied a total enterprise value of $3.7 billion at $8.05 per share.
The take-private transaction closed in February 2023.
Weber and Blackstone completed their business combination on May 5, 2025, while continuing to operate as distinct brands.
Weber’s 2025 collection marked the 30th birthday of the SPIRIT gas grill line.
Weber revenue statistics
Weber’s public financial history shows a sharp pandemic-era sales jump in 2021 followed by a meaningful pullback in 2022 as consumer demand normalized and macroeconomic pressures weighed on both in-store and online traffic.
Label
Bar
Value
2020
$1.53B
2021
$1.98B
2022
$1.59B
Max = $1.98B. Widths: 2020 76.94%, 2021 100.00%, 2022 80.00%
Weber regional sales statistics
Even in the down year of 2022, the Americas remained Weber’s largest sales region by a wide margin, while EMEA was still a substantial second pillar and APAC stayed comparatively small.
Label
Bar
Value
Americas
$820M
EMEA
$613M
APAC
$154M
Max = $820M. Widths: Americas 100.00%, EMEA 74.76%, APAC 18.78%
Weber geographic revenue mix statistics
Weber’s 2020 mix shows just how North America-centric the company remained, but it also highlights a meaningful international business, especially across EMEA.
Weber’s management-estimated retailer share figures underline how strong the brand was inside major U.S. grilling aisles even before the company pushed harder into direct digital channels.
Label
Bar
Value
Ace Hardware
52%
Home Depot
39%
Lowe’s
32%
Max = 52%. Widths: Ace Hardware 100.00%, Home Depot 75.00%, Lowe’s 61.54%
Weber digital growth statistics
Weber’s filing showed a business that was already becoming much more digital, with website growth outpacing the broader DTC operation and helping shift more outdoor-cooking purchases online.
Label
Bar
Value
DTC + e-commerce annual growth since 2018
31%
DTC business CAGR since 2018
47%
Weber.com CAGR since 2018
135%
Global site visits growth in 2020
83%
Max = 135%. Widths: DTC + e-commerce annual growth since 2018 22.96%, DTC business CAGR since 2018 34.81%, Weber.com CAGR since 2018 100.00%, Global site visits growth in 2020 61.48%
What these Weber statistics show
The main takeaway is that Weber entered the 2020s with enormous brand strength, broad retailer coverage, and meaningful international reach. The company paired that legacy wholesale presence with a much stronger digital strategy, using Weber.com, branded stores, and Grill Academy locations to deepen customer relationships and grow direct sales.
The sales curve also shows why Weber’s recent history looks so uneven. Revenue surged during the outdoor-living boom, peaked in fiscal 2021, and then fell back in 2022 as inflation, weaker traffic, and tougher comparisons hit demand. Because Weber went private in 2023, the last full public revenue base is fiscal 2022, while the more recent official updates focus on ownership, product launches, and the Blackstone combination rather than public quarterly revenue.
Sources
Weber S-1 filing, 2021
Weber 2021 Form 10-K
Weber fiscal 2022 results release
Weber SEC take-private announcement, December 2022
Business Wire take-private closing announcement, February 2023
Weber and Blackstone combination announcement, May 2025
Browse our top 10 BBQ grill stations with storage that promise to elevate your outdoor cooking experience—discover which one fits your grilling needs best!